
Christina Evangelin Ebinezer
Marketing Associate



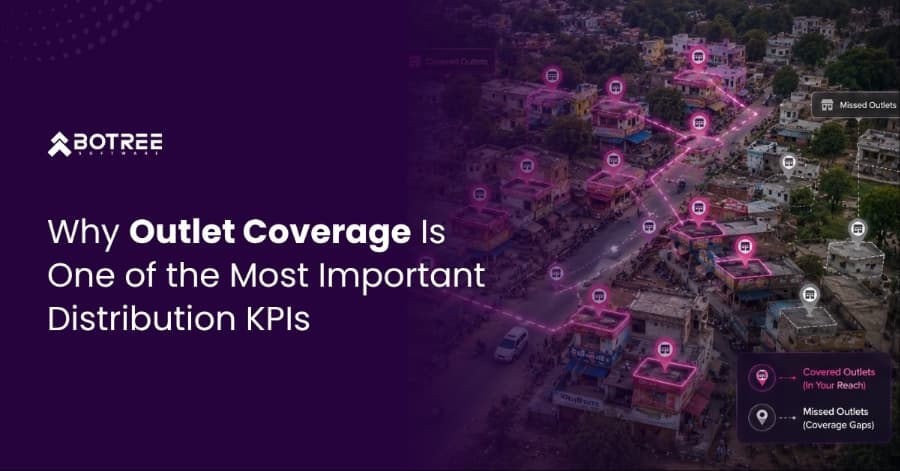
Without coverage in an outlet, the product will not get sold there. However good the brand’s product portfolio, price policy, and trades may be, sales potential goes untapped due to outlets being out of the coverage zone. With millions of retail outlets in the highly competitive FMCG industry driving purchase decisions daily, covering these outlets properly plays a very important role for growth.
That is why top FMCG brands monitor Outlet Coverage as one of their major Distribution KPIs. They can see their market reach and field execution performance through this metric which, in turn, influences product availability, sales, and market share directly.
In this blog, we will talk about what outlet coverage is, why it is important, the metrics brands need to monitor, and the approaches used by the best performing FMCG brands to improve outlet coverage.
Outlets Covered can be defined as the number or percentage of retail outlets that are being served by a brand, distribution organization, or field sales force within a particular territory or market.
In simple terms, it answers a fundamental question:
“How many outlets are we actually reaching and servicing?”
Outlets covered is more than just the presence of outlets within the territory of a distributor. An outlet is said to be covered when it is visited, serviced, or engaged using field execution activities like collecting orders, merchandising, inventory checks, etc.
Outlet coverage earns its place as a foundation KPI not because it is the most sophisticated metric in the FMCG KPI set but because every other distribution metric depends on it. Here is why:
Each individual outlet is a potential money generator for the organization. The more outlets that are serviced by the brand, the greater the possibilities of generating orders and sales. Weak outlet coverage means limited reach of the brand, whereas good coverage will create many opportunities for revenue generation.
Outlet coverage is the foundation for many other distribution metrics. Numeric Distribution, Weighted Distribution, Share of Shelf, Range Selling, Must-Stock SKU Compliance, and Planogram Compliance all depend on regular outlet visits. Without outlet coverage, brands cannot effectively measure, manage, or improve these KPIs.
Missing an outlet visit will put the brand in danger of creating situations where there might be stockouts and missed opportunities for orders and sales. Over time, such a situation allows competing brands to get a stronghold in the market, making it increasingly difficult and costly to catch up.
Good outlet coverage will guarantee that the product is available on the shelves through proper order collection and replenishment activities. Good outlet coverage will minimize the risk of stockouts and increase the probability of a customer purchasing the product.
The degree of outlet coverage is the degree of market coverage for a brand and the extent of its distribution. By improving coverage, the brand is increasing its ability to generate revenues in the new markets.
Outlets coverage is the basis for all retail execution activities. It allows conducting promotions, bettering merchandising, tracking competitors’ performance and having stronger relationships with retailers.
Tracking outlet coverage requires more than counting outlet visits. The following KPIs help FMCG brands measure coverage quality, field productivity, and distribution effectiveness.
| Metric | What It Measures | Formula | Why It Matters |
|---|---|---|---|
| Total Calls (TC) | Total outlets visited by a sales rep during a period | Total outlet visits | Indicates the overall field activity and market reach of the sales team. |
| Productive Calls (PC) | Outlet visits that result in an order | Order-generating visits | Measures how effectively outlet visits are converted into sales opportunities. |
| Strike Rate | Percentage of visits that result in an order | PC ÷ TC × 100 | Helps evaluate the quality of outlet targeting and field execution. |
| Beat Coverage % | Planned outlets visited versus planned outlets assigned | Visited Outlets ÷ Planned Outlets × 100 | Shows whether field teams are consistently covering the outlets assigned to them. |
| Effective Coverage Outlet (ECO) | Outlets that generated at least one invoice during a period | Billed Outlets ÷ Total Outlets × 100 | Measures the percentage of outlets actively contributing to sales. |
| New Outlet Addition | Growth of the active coverage universe | New Outlets Added per Month | Indicates the brand’s ability to expand market reach and unlock new revenue opportunities. |
Together, these metrics provide a complete view of Outlet Coverage, Field Sales Productivity, and overall Distribution Performance, helping FMCG brands identify coverage gaps, improve execution, and drive sustainable growth.
Most outlet coverage problems are structural and predictable; they arise from the same root causes in organisation after organisation. Understanding them is the first step to fixing them:
While the field teams tend to target easily accessible, easily convertible, or well-known by retailers outlets, high-potential outlets that need more effort and are located in difficult locations may be ignored, thus creating coverage gaps in the outlets with the highest potential of increasing sales.
The markets always change. There are new outlets opened; there are closed outlets; there are changes in priorities among the outlets. And when the beat plans are not updated frequently enough, field teams end up serving an obsolete set of outlets.
There are many FMCG brands with inactive outlets that haven’t placed any orders for several months. But without a procedure for identifying and activating these outlets, these outlets eventually get lost despite being profitable opportunities.
When the outlet visits are simply recorded in the SFA system without any consideration for whether the salesperson is actually placing orders, conducting shelf checks, making range sell calls, or speaking with retailers, the coverage numbers may appear good but the execution will be poor.
Certain territories have more outlets than the sales rep is able to cover and some territories may even be under-covered. This creates unbalanced territory sizes and inconsistent coverage frequency and coverage rates.
The lack of visibility into outlet visits, productive calls, beat compliance, outlet coverage, and coverage holes make it hard for managers to see where execution problems lie.
Improving outlet coverage is not a motivation problem – it is a design, data, and systems problem. These are the strategies that consistently move the needle:
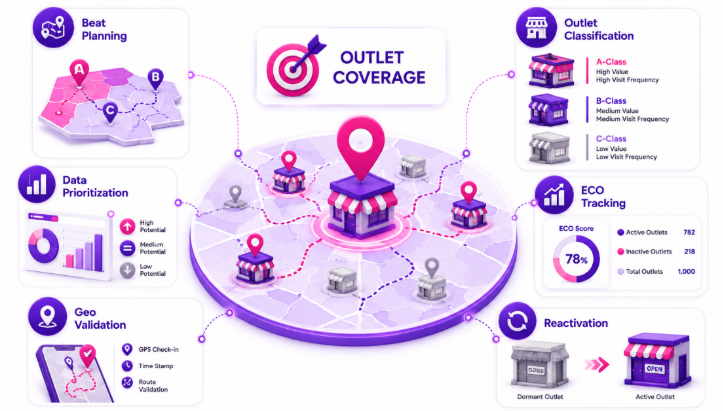
A beat plan devised only on the basis of geographic convenience might be easy in terms of transportation but does not necessarily guarantee commercial success. Priority should be given to high-potential outlets rather than lower contributing outlets. Brands need to use their sales potential, outlet class, ECO, and Weighted Distribution to determine priorities for their field operations.
Outlets have different levels of importance for field operation. A-class outlets might need to be visited frequently, several times a week; however, B-class and C-class outlets can follow another coverage frequency. The proper categorization of outlets based on actual sales and market potential helps to optimize field resource allocation.
The basis for coverage should be outlet potential and not convenience. It is possible to apply sales data, productivity indicators, market potential, and Retail Intelligence data for the determination of such priorities.
Effective Coverage Outlet (ECO) is a metric indicating the number of active outlets contributing to the sale of products or services. The tracking of ECO will help the managers to detect problems in the coverage network, deal with the problem outlets, and make the coverage network more commercially effective.
Dormant outlets might be outlets from which additional revenues could be received. With a structured program to revive dormant outlets by targeting them with reactivation campaigns, brands will be able to increase the productivity of outlets and grow their active coverage network without expanding it through new outlets.
Geo-validated visit data allow for ensuring that the visits to the outlets take place and prevent any coverage inflation. GPS check-in, timestamps, and route validation will provide managers with more transparency about field activities.
Outlet coverage and beat planning are two sides of the same execution discipline. Coverage is the outcome – what percentage of the outlet universe was visited. Beat planning is the process – how the outlet universe is organised into visit schedules that make achieving that coverage outcome realistic. You cannot fix a coverage problem without addressing the beat plan that produces it.
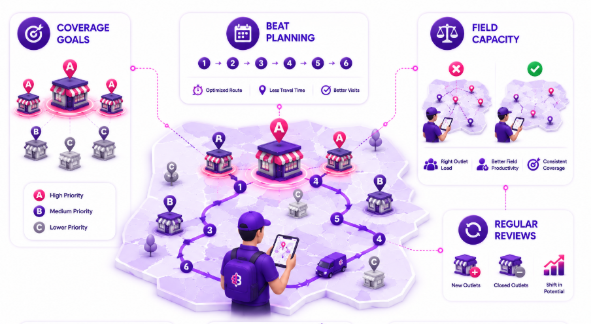
Beat routing is all about balancing between the number of outlets, travel time, and visit efficiency. The outlets having higher sales potential must have a higher visit frequency compared to other outlets and outlets having the same geographical location to minimize travel time and increase field efficiency. The main aim is not to maximize visit frequency but visit efficiency.
The marketplace is dynamic and changes take place every now and then. New outlets keep getting opened and some existing outlets may even shut down, and the sales potential also keeps changing over time. Evaluating beat plans on a quarterly basis makes sure that the field teams cover only those outlets which are currently having sales potential.
One of the most common reasons for bad coverage of outlets by field representatives is the overload of their territories. The salesperson is assigned more outlets than can be covered properly and the frequency of visit decreases and high potential outlets are also ignored. This problem can be addressed through periodic territory rationalization.
Technology does not replace the field execution discipline that outlet coverage requires — but it makes that discipline measurable, manageable, and consistently enforceable at scale across large field organisations.
SFA-based coverage tracking: Sales Force Automation (SFA) provides real-time visibility intooutlet visits, beat adherence, Total Calls (TC), Productive Calls (PC), Strike Rate, and Effective Coverage Outlet (ECO). Geo-verified check-ins and check-outs help avoid any ghost visits and increase accountability among the field force.
AI-enabled beat optimization: The AI system enables prioritizing outlet visits based on sales potential, outlet class, ECO, last order date, and Weighted Distribution. This would help the field force focus on the outlets making maximum commercial impact and enhance field productivity.
Automated coverage gaps alerts: The latest SFA solutions can automatically alert the management of any missed visits, inactive outlets, reduced frequency of visits, or inactive accounts. This helps the managers address the gaps in the coverage prior to impacting the sales performance.
Identifying new outlets and expanding the coverage universe: With mobile first approach, sales representatives will be able to add outlets to the coverage universe directly from the field, capturing all the relevant details about the outlets – their geolocation, contacts and classification.
Coverage analytics: Coverage dashboards offer visibility into the performance of outlet coverage by territory, reps and regions. With coverage, productivity and sales data combined, the brands can make quicker distribution decisions.
Botree helps FMCG brands improve outlet coverage by combining outlet intelligence, field execution, and real-time visibility into a single platform.
Outlet coverage is more than just an operational indicator—it forms the base for all distribution performance activities. Any order, any relationship with a retailer, any shelf space initiative, and any sales activity starts with the outlet visit.
Brands which are able to increase their outlet coverage regularly will be capable of increasing the product availability, Numeric Distribution, retail execution, and visibility of the market opportunities. Moreover, they will be able to direct their field efforts towards outlets that have the biggest commercial effect.
Given the fact that the size of the distribution network gets bigger every day, it is not enough to manage outlet coverage through manual planning and regular reviews. Now real-time visibility, beat planning, prioritization of outlets, and effective field execution are required.
The winners of the FMCG category are not those companies that have the biggest number of outlets, but those who cover the right outlets on a regular basis and with the right level of execution.

Marketing Associate
Meet Christina Evangelin Ebinezer, our dynamic marketing associate at Botree Software. With a background in HR and marketing, and prior experience as a content writer, Christina brings a sharp eye for storytelling and a knack for crafting engaging blogs and marketing content. She’s passionate about turning ideas into words that drive impact. Outside of work, Christina finds joy behind the piano keys or the wheel—whether she’s playing a soulful tune or cruising down open roads.
What is a good outlet coverage percentage for an FMCG brand?
How often should retail outlets be visited?
Why do outlet coverage numbers look healthy while sales remain flat?
What causes outlets to become dormant?
How does outlet coverage impact Numeric Distribution and Market Share?
How can technology improve outlet coverage?

Stay updated with the latest trends and insights.