
Christina Evangelin Ebinezer
Marketing Associate



Even when two products have equal outlet presence, they can produce entirely dissimilar levels of sales volume.
Think about two brands, Brand A and Brand B, being present in 50 out of 100 shops. It appears their outlets are the same at first glance. However, let’s assume that Brand A is sold in highly profitable outlets, while Brand B’s presence is mostly restricted to those of low profitability.
Here comes into play the concept of Weighted Distribution.
The optimization of Weighted Distribution for FMCG brands makes more sense than simply adding outlets in terms of boosting sales volume. Weighted Distribution allows FMCG brands to focus on profitable outlets, optimize their Distribution Efficiency, and benefit the most from their Retail Execution strategy.
Let’s discuss what Weighted Distribution means, how it is calculated, how it differs from Numeric Distribution, and, finally, why Weighted Distribution is one of the most crucial KPIs for FMCG brands in this article.
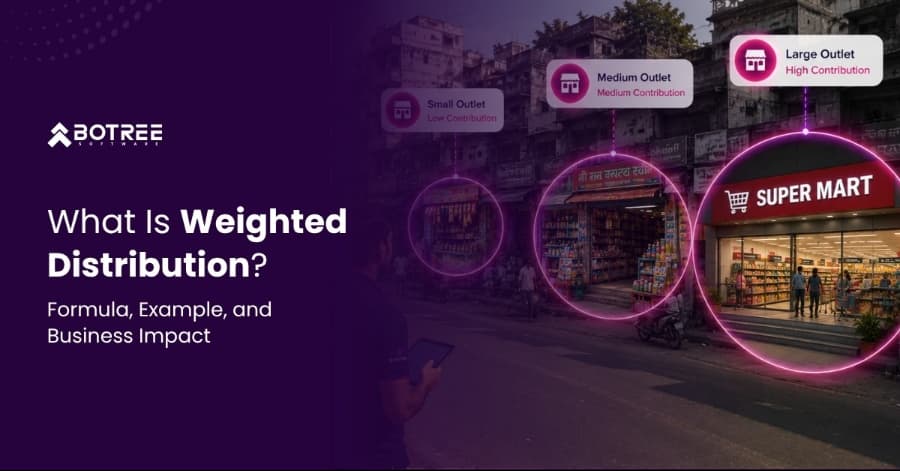
Weighted Distribution (WD) is an essential metric in the field of FMCG and retail, and it does not just measure how many outlets have your product, but also its relevance in relation to sales. Unlike simple numeric distribution, Weighted Distribution is measured according to the sales volume of individual outlets for your product category, therefore ensuring that having your product distributed in high-volume selling outlets increases your weighted distribution compared to low-volume selling outlets. If your product is in fewer outlets but the sales volume of these outlets’ accounts for much of the sales of the category, then you will have high weighted distribution.
Although both metrics measure distribution reach, they answer different business questions.
| Numeric Distribution | Weighted Distribution |
|---|---|
| Measures the percentage of outlets stocking a product. | Measures the percentage of category sales represented by outlets stocking the product. |
| Treats every outlet equally regardless of sales volume. | Gives more importance to high-selling outlets. |
| Indicates product reach across the market. | Indicates product presence in high-value outlets. |
| Focuses on the quantity of distribution. | Focuses on the quality of distribution. |
| Useful for measuring market coverage. | Useful for identifying sales growth opportunities and distribution effectiveness. |
The formula for weighted distribution is straightforward but applying it correctly requires outlet-level category sales data, which is where most FMCG brands need the right systems in place.
WD (%) = (Category sales in outlets stocking your brand ÷ Total category sales across all outlets) × 100
Example:
This means your brand is present in outlets that together account for 70 percent of all category sales in that territory regardless of how many outlets that represents as a percentage of the total outlet count.
Always calculate weighted distribution at SKU level, not just brand level. A brand may have 75% weighted distribution overall while a key new SKU sits at 30% – present only in low-value outlets. SKU-level WD tracking is what reveals these gaps before they become product launch failures.
Weighted distribution is more than a matter of analysis; it is a key indicator of financial success. Here’s why weighted distribution should be part of every FMCG brand’s KPIs:
Most FMCG categories have a small number of outlets driving a big chunk of the category’s sales. Weighted Distribution helps to check if a brand has access to these valuable outlets instead of just counting the number of outlets.
When Weighted Distribution starts to fall, it signals that a brand has lost some of its outlets, is not present enough, or is facing competition. Monitoring WD enables brands to discover potential revenue risks even before they show up on their sales reports.
The successful launch of new products relies on having visibility in the outlets where consumers purchase from. High levels of Weighted Distribution ensure greater visibility and can increase the chances of success.
By identifying high value outlets through weighted distribution analysis, brands can optimize their Retail Execution activities such as merchandising, stock checks, promotions, and engaging with retailers.
Generally, brands with high WD have greater visibility in their most valuable outlets. Consequently, Weighted Distribution is usually a good predictor of Market Share gains.
Unlike the approach that distributes resources equally among all outlets, the Weighted Distribution strategy enables marketers to concentrate their investment in places that have great potential for success.
Despite its importance, weighted distribution is consistently mismanaged in FMCG organisations. These are the mistakes that most directly limit growth:
Improving weighted distribution is not about adding more outlets indiscriminately. It is about systematically identifying and activating the right outlets, the high-value, high-throughput points of sale where category sales are concentrated and ensuring the brand is present, visible, and correctly stocked in all of them.
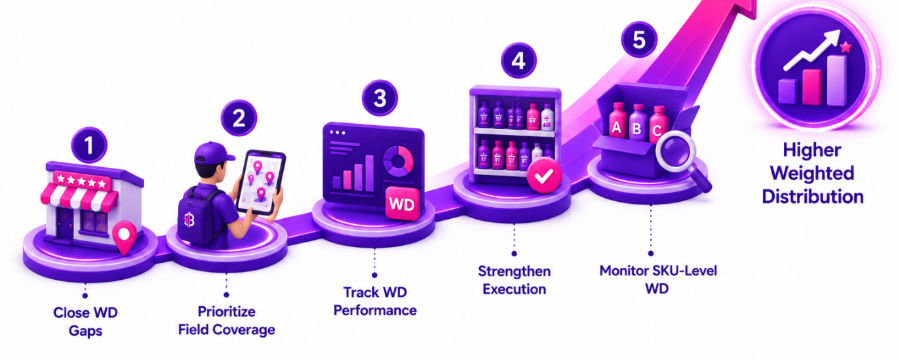
Rather than opening new outlets, the quickest route to enhance Weighted Distribution comes through analyzing where the brand is missing from high-value outlets. Examining the sales of the category and your distribution can guide where you activate more outlets to deliver the most business benefits.
Not every outlet is equal. High-WD outlets must be visited more frequently and get higher levels of retailer engagement and execution focus than low-contribution outlets. Organizing your territory based on outlet value, rather than geographic region, will boost efficiency and sales.
Weighted Distribution should be measured just like Numeric Distribution, Productive Calls, and Outlet Coverage. By routinely reviewing WD performance during evaluations, field organizations will be incentivized to concentrate on improving their WD.
High contribution outlets should be the initial focus for merchandising, planogram, availability, and promotion execution activities. By focusing on Perfect Store programs for high-WD outlets, companies are able to secure their sales, increase visibility, and maximize their return on investment from trade activities.
Weighted Distribution at the portfolio level can mask several challenges within SKUs. The monitoring of Weighted Distribution at SKU level, especially when it is about new products, will enable brands to identify the right SKUs for the top-selling outlets.
Weighted distribution is harder to track than numeric distribution because it requires outlet-level category sales data not just a count of which outlets stock the product. The right technology infrastructure makes this data available, actionable, and integrated into the field execution workflow.
Botree helps FMCG brands improve Weighted Distribution by combining outlet intelligence, secondary sales visibility, and field execution into a single platform.
For a distribution-driven FMCG business, growth depends on maintaining visibility across distributors, inventory, and retail demand. As Jyothy Labs expanded its operations, improving distribution efficiency and secondary sales visibility became a key priority.
Using Botree’s DMS platform, Jyothy Labs gained better visibility into distributor inventory, secondary sales, schemes, and claims management across its distribution network. This enabled faster decision-making, improved stock availability, and stronger execution across retail channels.
Key outcomes included:
By improving visibility across the distribution network, Jyothy Labs strengthened its ability to identify growth opportunities and improve execution where it mattered most.
Weighted Distribution is one of the best ways to measure distribution quality and predict sales potential.
Just because a brand can be found in hundreds or even thousands of outlets does not mean that it is present in outlets driving category sales. This is the reason why successful FMCG companies monitor both Numeric Distribution and Weighted Distribution: the former shows presence, the latter – commercial value.
Building a better Weighted Distribution means working with high-value outlets, enhancing presence in them, optimizing retail execution, and making sure that the necessary SKUs are found in places of high demand.
Thanks to outlet-level insight, Secondary Sales data, advanced outlet selection based on Artificial Intelligence, and analytics of distribution metrics, FMCG companies can take their distribution measurement to another level and actually improve it.
By doing this, they achieve greater market presence, increase sales efficiency, enhance launch performance, and grow their Market Share.
Nowadays, when the competitive FMCG landscape is becoming increasingly challenging, the point is not just whether or not my product is available in various outlets. The key is whether I am present in the ones that count.

Marketing Associate
Meet Christina Evangelin Ebinezer, our dynamic marketing associate at Botree Software. With a background in HR and marketing, and prior experience as a content writer, Christina brings a sharp eye for storytelling and a knack for crafting engaging blogs and marketing content. She’s passionate about turning ideas into words that drive impact. Outside of work, Christina finds joy behind the piano keys or the wheel—whether she’s playing a soulful tune or cruising down open roads.
What is a good Weighted Distribution score in FMCG?
Can a brand have high Numeric Distribution but low Weighted Distribution?
Why is Weighted Distribution important for new product launches?
How often should FMCG brands measure Weighted Distribution?
What data is required to calculate Weighted Distribution accurately?
Which is more important: Weighted Distribution or Numeric Distribution?






Stay updated with the latest trends and insights.