
Christina Evangelin Ebinezer
Marketing Associate



It is impossible for a product to sell if the product is not available in the outlet.
Before brand marketers think of market share, retail execution, or shelf availability, they need to ask themselves one basic question: How many outlets carry the product?
This is precisely what Numeric Distribution does.
Numeric Distribution is perhaps the most critical parameter for measuring Product Reach and Market Reach for FMCG brands. Numeric Distribution allows brand marketers to measure how far their products have penetrated the retail landscape and identify gaps in distribution that could be hindering their growth.
This is what we will cover in this blog: What is Numeric Distribution? How is it measured? Why is it important? And how do leading FMCG brands improve their Numeric Distribution?
Numeric Distribution (ND) refers to the percentage of retailers who stock a brand or product in a specific market at a particular point in time.
It is perhaps the most common distribution metric in FMCG since it shows how widespread the distribution of a brand is in a particular market. Simply put, ND informs a brand about the availability of its products in the market.
The formula for numeric distribution is straightforward — but applying it correctly requires a well-defined outlet universe and reliable stocked-availability data from the field.
Example: If there are 10,000 relevant retail outlets in a territory and your product is stocked in 6,500 outlets, then:
Numeric Distribution = (6,500 ÷ 10,000) × 100 = 65%
This means your product is available in 65% of the outlets within that market.
The remaining 35% of outlets represent a distribution gap and a potential opportunity to expand product availability and increase market reach.
Although both metrics measure distribution reach, they answer different business questions.
| Numeric Distribution | Weighted Distribution |
|---|---|
| Measures the percentage of outlets stocking a product. | Measures the percentage of category sales represented by outlets stocking the product. |
| Treats every outlet equally regardless of sales volume. | Gives more importance to high-selling outlets. |
| Indicates product reach across the market. | Indicates product presence in high-value outlets. |
| Focuses on the quantity of distribution. | Focuses on the quality of distribution. |
| Useful for measuring market coverage. | Useful for identifying sales growth opportunities and distribution effectiveness. |
Numeric distribution is not a vanity metric – even though it can be managed as one. At its core, it measures the physical availability that is the prerequisite for every commercial outcome in FMCG. Here is why it matters across the brand’s entire commercial agenda:
If a consumer comes to a kirana, decides to purchase your product but does not see it on the shelves, he/she will either purchase a competitor’s product or simply not purchase anything. No matter what kind of brand equity you have built, no matter how good your advertisement or promotions were, no product will sell if it is not physically available to consumers at the right time. Physical availability (numeric distribution) is the cornerstone upon which all marketing and selling activities depend.
For new product launch, numeric distribution within the first 90 days is one of the most powerful indicators of future success. A SKU that achieves high coverage of its relevant outlets quickly will achieve higher level of shopper trial, higher retailer conviction and increased sales velocity compared to a SKU with low coverage.
Even minor increases in numeric distribution may lead to meaningful commercial results. If there are 50,000 relevant outlets in your territory, then a 1% increase in numeric distribution equals 500 additional stocking points. When multiplied across multiple territories, incremental distribution gains can translate into substantial revenue growth.
Numeric Distribution offers a lot of useful information about the demand forecast. The fast-growing distribution is a signal of the future demand increase, whereas the reduction in distribution indicates poor performance of a product. Monitoring the ND on an SKU and geographical level assists brands in making more accurate forecasts.
Each new distributor which sells a brand product is another chance for a consumer to find out and buy a product. High Numeric Distribution increases the reach of the brand through the geography, channel mix, and outlet type.
Numeric Distribution shows those products which are not distributed yet. These insights help prioritize distribution investments and improve overall market penetration.
Numeric Distribution provides a high-level view of product reach, but leading FMCG brands go beyond the headline percentage. They track additional metrics to understand where distribution gaps exist, which products are under-distributed, and where the greatest expansion opportunities lie.
| Metric | What It Measures | Why It Matters |
|---|---|---|
| Numeric Distribution (%) | Percentage of outlets stocking the product | Measures overall product reach and market penetration |
| Active Outlets | Outlets that generated at least one order during a defined period | Identifies how much of the distribution network is actively contributing to sales |
| SKU-Level Distribution | Numeric Distribution for individual SKUs | Highlights assortment gaps and under-distributed products |
| New Outlet Addition | Number of new outlets added to the distribution network | Measures market expansion and distribution growth |
| Numeric Distribution by Territory | Product availability across regions or territories | Identifies geographic distribution gaps and white-space opportunities |
| Numeric Distribution by Channel | Product availability across GT, MT, pharmacy, HoReCa, and other channels | Helps optimize channel-specific distribution strategies |
Low numeric distribution is rarely the result of a single failure. It is almost always the combined effect of several root causes operating simultaneously. Identifying which ones are driving the ND gap in a specific territory is the prerequisite for choosing the right fix:
Improving ND requires addressing the right root cause with the right strategy. Here are the five approaches that consistently deliver sustainable ND improvement in India FMCG:
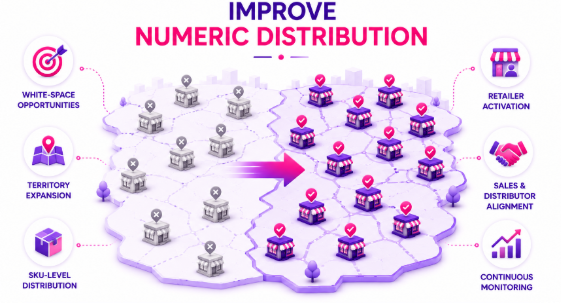
One of the easiest ways to boost Numeric Distribution is to look for opportunities in those outlets where the product is yet not being offered. An analysis of the outlet universe in terms of territory, channel, and outlet type would enable the brands to understand white-spaces better.
Improving the Numeric Distribution in all territories at once may prove to be a dilution of resources and poor quality of execution. The systematic improvement of Numeric Distribution should thus take place territory by territory.
Strong brand-level distribution can often hide significant SKU-level gaps. Monitoring SKU-Level Distribution helps identify under-distributed products, assortment gaps, and new launches that require additional focus, ensuring the right products reach the right outlets.
New outlets will become part of the Numeric Distribution if they consistently carry the brand’s products. This means that reducing the complexity of retailer onboarding, increasing the availability of products, and helping retailers during the onboarding process will enable brands to activate newly onboarded outlets faster.
In order to optimize Numeric Distribution, there needs to be a proper coordination among field sales, distributors, and territory managers of the company. This way, companies can increase their distribution if they coordinate their efforts toward outlet growth, market coverage, and distribution optimization.
Numeric Distribution is an ongoing process. Products get distribution every day and products lose distribution every day based on the decisions made by the retailers regarding assortment.
Numeric distribution is only as accurate as the data that feeds its calculation and only as actionable as the systems that surface gaps in real time and connect them to field execution workflows. Here is how technology transforms ND from a periodic reporting metric into a live operational tool:
Botree helps FMCG brands improve Numeric Distribution by providing complete visibility into their outlet universe, distribution gaps, and expansion opportunities. Through OutletPulse, brands can identify underserved territories, channels, and outlets with the highest growth potential. Botree SFA enables field teams to improve outlet coverage, onboard new outlets faster, and track SKU-level distribution across territories and channels. Combined with AI-driven insights and real-time dashboards, Botree helps sales teams prioritize the right outlets, improve product availability, and expand distribution reach more effectively.
With the expansion of the distribution channel for FMCG, ensuring visibility within the thousands of distributors and retail outlets is becoming more difficult for brands. As for brands that have achieved success on a large scale, enhancing their Numeric Distribution becomes essential through improved data on outlets, execution speed, and visibility into their distribution process.
Jyothy Labs was able to enhance the operation process of its distributors and achieve higher visibility into its distribution system through utilizing Botree DMS solution. With an ability to manage 3,500 distributors, more than 20,000 scheme combination, and faster order-to-bill execution, Jyothy Labs managed to achieve higher execution speed and control secondary sales and distribution processes.
Numeric Distribution is one of the key factors of FMCG distribution – how many places do consumers get access to the product?
The broader Numeric Distribution of any product means a bigger opportunity to get consumer trials and make repeat buys and increase market share. But improvement of Numeric Distribution is not only a process of increasing number of outlets, but the one which demands the knowledge of the entire outlet universe, good coverage by distributors, field execution, and continuous identification of distribution gaps at the outlet and SKU level.
With the development of market fragmentation and growth of competition for shelf space, brands which can systematically extend the availability of their products will have an obvious advantage over the competitors which base their efforts on periodical distribution audits and intuitive decisions on extending distribution.
Numeric Distribution is not just a KPI – it is a measure of market accessibility. The brands which can improve Numeric Distribution have more opportunities to get access to their products by consumers.

Marketing Associate
Meet Christina Evangelin Ebinezer, our dynamic marketing associate at Botree Software. With a background in HR and marketing, and prior experience as a content writer, Christina brings a sharp eye for storytelling and a knack for crafting engaging blogs and marketing content. She’s passionate about turning ideas into words that drive impact. Outside of work, Christina finds joy behind the piano keys or the wheel—whether she’s playing a soulful tune or cruising down open roads.
What is a good Numeric Distribution percentage in FMCG?
Why is Numeric Distribution important for new product launches?
What is SKU-level Numeric Distribution?
How does Numeric Distribution help identify white-space opportunities?
How often should Numeric Distribution be measured?
How do SFA and DMS help improve Numeric Distribution?


Stay updated with the latest trends and insights.