
Christina Evangelin Ebinezer
Marketing Associate



Here is a number that should stop any brand manager cold: nearly 25% of FMCG products face stockouts at the retail level at any given time. Not because stock doesn’t exist, but because no one at the brand end knows it’s gone.
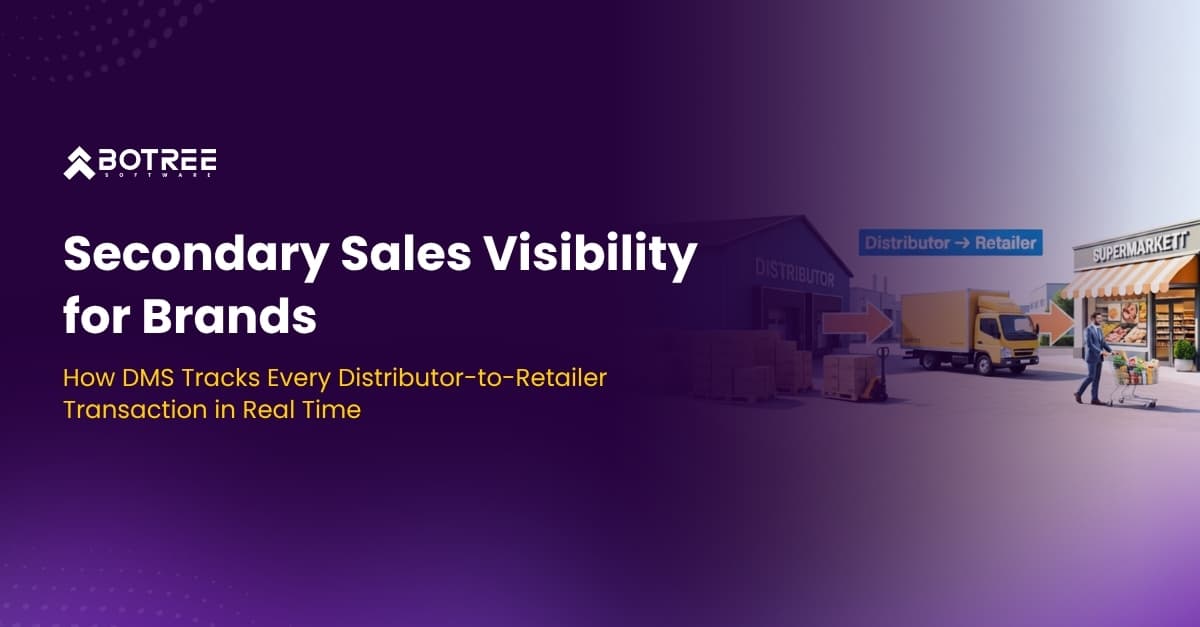
That is the secondary sales visibility problem in plain language. Brands track what they sell to distributors (primary sales) with precision. They run dashboards, set targets, review weekly reports. But the moment stock leaves the distributor’s warehouse and moves toward retailers, most brands go dark.
No real-time data. No outlet-level sell-out. No proof that schemes reached the retailer. No signal that a top-performing outlet has been out of stock for five days.
A Distribution Management System (DMS) a real one, not a distributor billing software with a new name which closes that gap. It captures every distributor-to-retailer transaction, syncs it to the brand’s dashboard in near real time, and gives both operations teams and sales leadership the visibility layer that FMCG distribution has been missing.
This guide explains what secondary sales visibility means, why most brands still don’t have it, exactly how a DMS captures and surfaces that data, and what brands can actually do once they have it.
Secondary sales is defined as the sale of products from distributors to retailers or outlets. It represents the actual movement of goods in the market after primary dispatches from the company. This level of sales provides a clear view of real demand and consumption patterns, making it essential for accurate forecasting and efficient replenishment.
Most people in FMCG can define primary sales instinctively. Secondary sales, less so. And tertiary is where most get confused. Here is the distinction that matters:
| Sales Layer | Transaction | Who Controls It | What It Measures |
|---|---|---|---|
| Primary Sales | Brand → Distributor | Brand / Sales Head | Offtake from company; distributor loading |
| Secondary Sales | Distributor → Retailer | Distributor (often opaque to brand) | Actual sell-out into the market |
| Tertiary Sales | Retailer → Consumer | Retailer (largely invisible) | End-consumer offtake; Nielsen/IRI proxy |
Secondary sales are the most commercially critical layer – and the one brands understand least.
Why it matters more than primary: Primary sales tell you how much stock you’ve pushed into the channel. Secondary sales tell you how much of that stock is actually selling through. A distributor can show strong primary offtake numbers while quietly sitting on three months of unsold inventory, a condition known as channel stuffing. Without secondary sales data, brands can’t tell the difference between a healthy channel and a bloated one.
Secondary sales data is also where scheme activation lives or dies. A scheme that runs at the distributor level but never reaches the retailer is money spent on a fiction. Secondary visibility is the only way to catch that.
A Distribution Management System is not a billing tool. It is not Tally with a dashboard bolted on. It is the intelligence and operations layer that sits between the brand and the last mile -connecting distributor operations to brand visibility in real time.
The confusion exists because many distributors use basic billing or accounting software (Tally, Busy, legacy ERP modules) that records transactions locally. A DMS captures the same transactions but routes the data upstream to the brand in near real time, structures it by outlet, SKU, scheme, and geography, and makes it actionable for both the distributor and the brand.
A DMS that doesn’t capture all of these is an incomplete system and the gaps will show up in your scheme leakage, stockout rate, and distributor performance benchmarking.
Most brands know they have a visibility problem. Few can describe it precisely enough to fix it. Here are the five specific failure mode, each one a real scenario in FMCG distribution today.
A brand runs a buy-10-get-2-free scheme through its distributor network for 45 days. The distributor receives the scheme and bills it correctly on primary orders. But at the retailer level, scheme activation is inconsistent – some retailers receive it, many don’t, and nobody can tell the difference until the scheme closes and the claim comes in.
Without outlet-level secondary sales data showing which retailers were billed the scheme, there is no audit trail. Scheme money is spent. Retailer trust is eroded. And the brand plans the next scheme on equally incomplete data.
The distributor’s primary offtake looks healthy. Stock is moving from the brand’s warehouse to the distributor on schedule. But when the secondary sales data arrives, a day or a weeks later showing that sell-out to retailers has been inactive for three months. The distributor is sitting on 90 days of stock.
This ghost inventory distorts demand signals, blocks replenishment to markets that actually need stock, and creates a working capital crisis for the distributor that eventually surfaces as a collections problem for the brand. The brand’s ERP shows green. The market is not green.
A top tier kirana outlet in a high-density urban zone runs out of a fast-moving SKU on Tuesday. The distributor’s salesperson is not scheduled to visit until Friday. The brand’s field salesperson visits on Thursday and catches it, but the outlet has already switched to a competitor SKU to fill the shelf gap.
Three days of lost sales at a single high-value outlet is a small number. Multiply it across thousands of outlets with no real-time stockout signal, and it becomes a material revenue leak. Real-time secondary sales visibility flags zero-stock conditions before the rep’s next visit, not after.
The brand has 40 distributors across a region. All 40 show similar primary offtake numbers. But secondary sell-out efficiency, or the sales value generated from inventory held, varies significantly across them. Distributor A is turning stock in 18 days. Distributor B is sitting on 52-day stock. Without secondary sales data, both distributors look the same on the primary sales dashboard.
The result: the brand allocates additional stock, schemes, and field support uniformly – rewarding underperformance and failing to address the root cause.
In many FMCG organisations, secondary sales data is still collected weekly or monthly via Excel reports submitted by distributor sales staff, or via manual DSR (daily sales report) entries that are compiled and shared upward. By the time that data reaches, the market has moved.
A stockout that could have been caught on Day 2 shows up in the report on Day 9. A scheme leakage that could have been corrected in Week 1 is discovered in the post-scheme review in Week 7. Data latency converts real-time business problems into historical analysis exercises.
Understanding how it works helps you know what to expect from a real DMS and what to question when a vendor claims real-time visibility but cannot support it.
| HOW A SECONDARY SALE IS CAPTURED — STEP BY STEP | |
|---|---|
| Step 1 | Distributor’s salesperson opens the DMS mobile app and selects the retailer (outlet mapped with code, name, GPS location, beat assignment) |
| Step 2 | Raises a sales invoice: SKU selected, quantity entered, applicable scheme auto populated from active scheme master |
| Step 3 | Invoice is saved – distributor stock is decremented in real time, transaction is time-stamped and geo-tagged |
| Step 4 | Data syncs to the brand’s central server – available on the brand dashboard within seconds to minutes (not days) |
| Step 5 | Brand head sees outlet visited, SKU billed, scheme activated, stock remaining at distributor – all in one view |
A DMS built for secondary sales visibility captures data at the outlet level – every transaction tagged to a specific retailer, in a specific beat, under a specific distributor. That granularity is what makes the downstream analytics actionable.
Visibility is not the end goal. What matters is what you can do with it. Here are the five concrete capabilities that secondary sales visibility enables – capabilities that are simply not possible without it.
With outlet-level DMS data with scheme management, the brand can see in real time data of which retailers have received scheme billing, and which haven’t. If a scheme is running for 45 days and after Day 15 only 40% of scheme-eligible outlets have received it, the sales head can intervene: investigate why, correct distributor billing behaviour, and recover the remaining 30 days of scheme impact.
Without this visibility, scheme leakage is only discovered in the post-scheme review – at which point the money is gone and the window is closed.
DMS inventory data shows distributor stock levels by SKU in near real time. When a fast-moving SKU drops below a defined threshold at a specific distributor or when a retailer hasn’t been billed that SKU in their normal replenishment cycle, the system flags it as a potential stockout risk.
They can act immediately: trigger an emergency delivery, redirect stock from a nearby distributor, or alert the field rep to prioritise that outlet on their next visit. The brand responds to a real-time signal, not a Thursday MIS report.
Once secondary sales data is available across the distributor network, the brand can rank distributors on sell-out efficiency not just primary offtake volume. Which distributors are moving stock fastest? Which are holding inventory? Where is scheme activation highest?
This benchmarking shifts distributor management from relationship-based decisions to data-based decisions. Incentives, stock allocations, and field support can be directed at distributors based on performance, not proximity or history.
When primary offtake is rising but secondary sell-out is flat, the brand has an early warning signal: channel stuffing is building up. Distributors are loading stock they can’t move. The brand can throttle primary sales, investigate the root cause, and prevent the inventory crisis before it becomes a collections crisis.
Without secondary visibility, this signal never reaches HQ until the distributor stops ordering — by which point the damage is done.
A brand launching a new SKU or running a market activation programme needs to know which outlets have already stocked it, which are eligible but haven’t been covered, and which are high priority based on footfall and category performance. That targeting is only possible with outlet-level secondary sales data.
Without it, campaigns run on territory-level plans that miss the outlets that matter most and include outlets that were already covered.
| WHAT SECONDARY SALES VISIBILITY UNLOCKS | |
|---|---|
| 1. | Catch scheme leakage in real time — not in post-mortem |
| 2. | Identify retailer stockouts before the next rep visit |
| 3. | Benchmark distributors on sell-out efficiency, not just primary offtake |
| 4. | Align primary and secondary sales to prevent channel stuffing |
| 5. | Run SKU launches and activations on real outlet data |
A reference framework for NSMs and brand heads building the case for DMS investment internally.
| Dimension | Primary Sales | Secondary Sales | Tertiary Sales |
|---|---|---|---|
| Definition | Brand to Distributor | Distributor to Retailer | Retailer to Consumer |
| Who owns it | Brand Head / Supply Chain | Distributor (often opaque) | Retailer (largely invisible) |
| Data source today | ERP / SAP | DMS (if deployed) | Nielsen, IRI, or eB2B signals |
| Visibility without DMS | High — brand controls it | Low to none | Very low |
| Visibility with DMS | High | Near real-time, outlet-level | Partial (via retailer app integration) |
| Where schemes live | Scheme loaded at distributor | Scheme must activate here | Consumer-facing promo |
| Stockout signal | Not visible at primary level | Catchable in real time | Too late — consumer already switched |
| Managed via | ERP + SFA | DMS + SFA integration | Retailer apps, ONDC, eB2B |
The DMS market is crowded with tools that promise secondary sales visibility but deliver distributor operations management with reporting added on. Here is how to tell the difference.
The five secondary sales blind spots identified earlier in this guide scheme leakage, ghost inventory, retailer stockouts, no distributor benchmarking, data latency each has a direct solution in how Botree DMS is built:
Real-time secondary sales visibility is the 2024–2025 priority for most FMCG brands still running on manual or batch-based distributor data. But for brands that have already solved the visibility layer, the next frontier is already visible.
The brands that will lead FMCG distribution in 2026 are not those with the largest distributor networks. They are those whose networks are fully visible and whose visibility is converting into decisions faster than their competitors.
The secondary sales layer is where FMCG brands win or lose in the market. It is where schemes activate or leak, where stockouts happen or are caught, where distributor performance is excellent or invisible, and where the gap between what a brand thinks is happening and what is actually happening on the ground is widest.
A Distribution Management System like Botree DMS that delivers real secondary sales visibility, outlet-level, real-time, scheme-auditable, and SFA-integrated does not just improve operations. It changes what decisions are possible. Brands that have it are managing a different business than brands that don’t.

Marketing Associate
Meet Christina Evangelin Ebinezer, our dynamic marketing associate at Botree Software. With a background in HR and marketing, and prior experience as a content writer, Christina brings a sharp eye for storytelling and a knack for crafting engaging blogs and marketing content. She’s passionate about turning ideas into words that drive impact. Outside of work, Christina finds joy behind the piano keys or the wheel—whether she’s playing a soulful tune or cruising down open roads.
What is secondary sales
Primary vs secondary sales
What is a Distribution Management System (DMS)?
What is scheme leakage?
How does DMS improve visibility?
How to track distributor-to-retailer sales in real time?
What is sell-out data?

Stay updated with the latest trends and insights.